Scale Your EC2 Cluster using Custom Metrics with Scalemate
Jan 14, 2018
If you are an avid reader of mine, you might have noticed that I haven't posted for quite some time (almost a year!). Time sure flies when you're having fun. I'll do my best to post much more in 2018.
And now, let's get to the matter at hand.
Motivation
Have you ever needed to scale your application servers using a custom metric, such as available system memory or concurrent connections count?
Some application servers need to be scaled when memory becomes a bottleneck as each client adds to the application's memory utilization, and in other cases, applications can only support a finite number of concurrent socket connections before reaching their limit.
It still surprises me that AWS CloudWatch does not provide metrics for monitoring EC2 servers' memory utilization. It seems so trivial, especially since other metrics such as CPU Utilization, Disk I/O, and Network I/O are readily-available. Also, a memory metric would make monitoring your servers for memory leaks so much easier, instead of finding out about leaks after the out-of-memory killer terminates your app, causing downtime.
It would have been great if AWS provided more metrics out of the box.
But no matter, that's where Scalemate comes in! (Get it? stalemate; play on words!).
Scalemate
Scalemate is a Node.js CLI package I built that scales your application servers by publishing custom system metrics to AWS CloudWatch. The following custom metrics are currently supported:
- Sockets Used - number of active client/server connections
- Memory Available - amount of system memory available (in mb)
In addition, Scalemate supports per-second metric resolution for scaling your cluster within seconds in response to high demand.
Usage
Using Scalemate is super easy. Simply install Node.js on one of the servers in your cluster and then install Scalemate using npm:
sudo npm install -g scalemate
Then, create a file called scalemate.js in /etc:
sudo nano /etc/scalemate.js
Paste in the following contents:
module.exports = {
    // Metrics to publish
    metrics: {
        // Number of open socket connections
        socketsUsed: {
            // Whether to publish this metric
            enabled: true,
            // CloudWatch unit type
            unit: 'Count',
            // CloudWatch metric title
            name: 'Sockets Used'
        },
        // Number of megabytes of system memory currently available
        memoryAvailable: {
            // Whether to publish this metric
            enabled: true,
            // CloudWatch unit type
            unit: 'Count',
            // CloudWatch metric title
            name: 'Memory Available'
        }
    },
    // Metric interval (in seconds)
    interval: 60,
    // CloudWatch namespace to associate metrics with
    namespace: 'MyApp',
    // AWS IAM user with CloudWatch read/write access
    credentials: {
        region: 'us-east-1',
        accessKeyId: 'ABCDEFG',
        secretAccessKey: 'ABCDEFGHIJK/HIJKLMNOPQRS'
    }
};
Modify the configuration according to your own needs, enabling or disabling metrics and configuring the following parameters:
namespace- a title for your app or server clustercredentials- an AWS IAM user with read/write access to CloudWatch
You can create an IAM user in the AWS Security Credentials console.
Make sure to grant your IAM user the CloudWatchFullAccess policy for read/write access to CloudWatch.
Testing
Test the configuration you created by running:
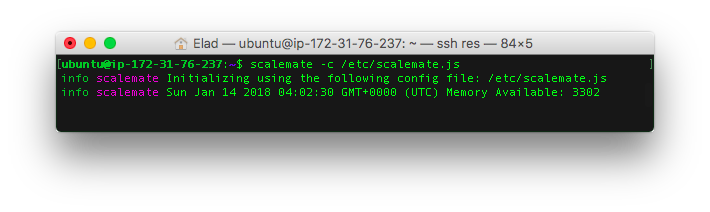
scalemate -c /etc/scalemate.js
Observe the terminal output for any initial errors and for successfully-published metrics. If no errors are emitted, you have successfully configured Scalemate!
Verification
Visit the CloudWatch console and find the published metrics under the Scalemate namespace.
Select your app namespace and you should be able to see the custom metrics you configured!
Surviving Reboots
To start Scalemate automatically after system reboots, edit your user's crontab by running:
crontab -e
Then, append the following line to the end of the crontab:
@reboot /usr/bin/scalemate -c /etc/scalemate.js 2> /tmp/scalemate.log &
Save and reboot, then, verify that Scalemate is running:
ps aux | grep scalemate
Finally, create an image of the server you installed and configured Scalemate on, and configure your entire EC2 cluster to use the same image. That way, the entire cluster will be publishing these custom metrics to AWS CloudWatch.
CloudWatch will, in turn, average out the metrics reported by all the servers in your cluster and let you define scaling alarms based on metric average values.
Scaling Your Cluster
Congratulations, you can now configure CloudWatch alarms in the AWS CloudWatch console based on these custom metrics!
Simply edit the existing CloudWatch alarms for your Auto Scaling Group and modify the metric being monitored, selecting one of the custom Scalemate metrics and defining an applicable alarm threshold based on the metrics.
Have any suggestions on additional custom metrics that should be added to Scalemate? Let me know in the comments! =)