Debug Remote Mono Apps with Xamarin Studio
Nov 11, 2015
The Mono Project is great. It lets you run your .NET apps on other platforms, including Linux! There are a number of benefits to this:
- You can run your .NET Mono apps in Docker to minimize deployment issues.
- You can run your .NET Mono apps on a
t2.microLinux instance, whereas, if you were to run them on a Windows Server instance with the same specs, you'd hardly be able to start up the instance, let alone run your app (because Windows needs a lot more compute power and RAM to run its OS). This also saves you some big bucks if you need to run your app on multiple servers, as Linux instances cost less than Windows instances. - You can run your .NET Mono apps scalably using Amazon Elastic Beanstalk or Amazon EC2 Container Service without setting up a deployment mechanism or taking care of scalability on your own.
However, as one soon discovers, .NET apps behave differently on Mono. You'll experience some unexpected behavior, weird implementations (such as partial TLS/HTTPS support), and bizarre exceptions that wouldn't occur on Microsoft .NET.
Debugging these can be a real hassle, since you are probably running your app on a weak Linux server, off in some remote datacenter. Luckily, the Mono Project provides a way for us to connect to our process remotely and debug it with Xamarin Studio!
Download Xamarin Studio
The first step is to download Xamarin Studio (MonoDevelop). If you download Xamarin Studio from the official Xamarin website, you'll have to install some other stuff as well (such as the Android SDK in case you don't have it already), so you should grab it from the MonoDevelop site instead.
Set a Mono Environment Variable
To be able to debug remote Mono apps, we need to set an environment variable named MONODEVELOP_SDB_TEST to 1. On Windows, you should set the variable in My Computer -> Properties -> Advanced System Settings -> Environment Variables.
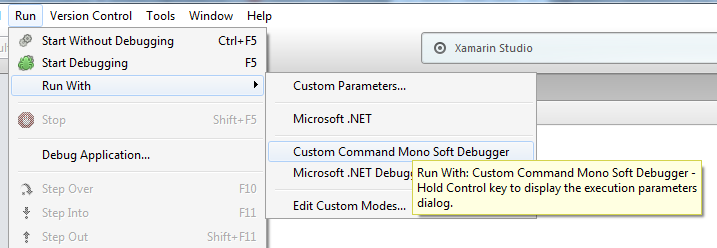
Xamarin Studio checks this environment variable (when launched) and displays a new option in "Run -> Run With" called Custom Command Mono Soft Debugger.
Generate Debugging Symbols for Your App
To debug Mono apps, you need to generate an .mdb file, which is Mono's variation of the .pdb file.
The .pdb file provides debug symbols for the executable and is generated automatically when you build your solution in Debug mode via Visual Studio. It contains metadata about your executable that links each function and variable to its exact line in your source code.
If you have the .pdb file from Visual Studio, you can convert it to an .mdb file with pdb2mdb as follows:
C:\Code\MyProject\packages\Mono.pdb2mdb.0.1.0.20130128\tools\pdb2mdb.exe C:\Code\MyProject\MyProject\bin\Debug\MyProject.exeAlternatively, you can build your entire solution on Linux using xbuild, and your .mdb file will be generated automatically.
Run Your Mono App in Debug Mode
After generating the .mdb, you need to copy both your .exe and .mdb to the target server running Mono.
The next step is to run Mono as you normally would, but with some additional parameters, namely --debug and --debugger-agent:
mono --debug --debugger-agent=transport=dt_socket,address=0.0.0.0:12345,server=y /path/to/Executable.exeThis will create a listener on port 12345 on your server for an incoming debugger connection from Xamarin Studio, as well as read from the .mdb file to interpret the app's debug symbols.
If you're running your server behind some firewall, make sure to open port 12345 (if you're running on EC2, make sure to add it to the EC2 server's security group).
Connect to the Debugger Agent
Now, all you need to do is open your solution in Xamarin Studio (it can open Visual Studio solutions), click Run -> Run With -> Custom Command Mono Soft Debugger.
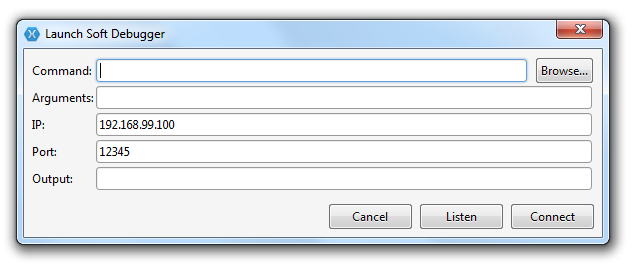
Then, simply enter the IP and Port of your Mono deployment, click Connect, and debug away!
Can't connect? Make sure that you can reach the debugger agent:
telnet 1.2.3.4 12345Replace 1.2.3.4 with your public server IP address.
Debug Away
You'll notice that your Mono app starts running only after the debugger has attached to it.
Feel free to set breakpoints, watch variables, step in, step out, etc. Almost all of Visual Studio's great debugging features are at your disposal (except edit-and-continue and dragging the current execution point).
Enjoy, and let me know if this helped you debug your Mono deployments!