Debug HTML Strings with Chrome in Visual Studio
Oct 24, 2015
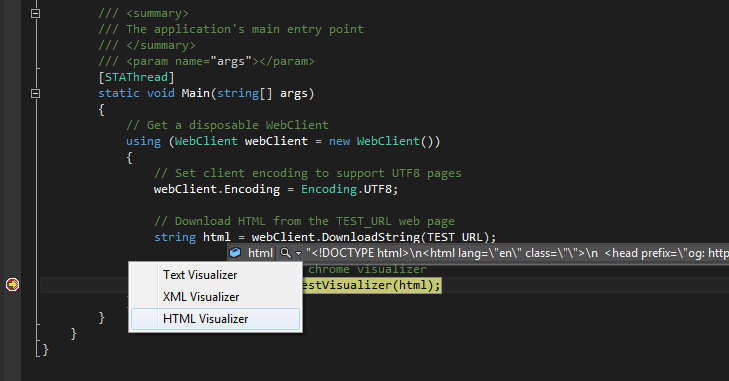
If you happen to work with HTML strings a lot in Visual Studio, I'm sure you must already hate the built-in HTML Visualizer. It just plain sucks, and there seems to be no way to fix it, nor any viable alternative.
- It freezes randomly, probably due to JavaScript code in your HTML
- It prevents you from continuing your debug session for 10 - 20 seconds while you wait for it to unfreeze
- Reopening it sometimes causes the same behavior, rendering it useless for the current HTML string
- It's powered by some weird implementation of Internet Explorer that behaves abnormally
These issues alone were enough to make me venture out and develop a Visual Studio Debugger Visualizer that renders HTML in a Chrome-based browser.
Why Chrome?
Because it's awesome.
- I love it, and so do more than 50% of the Internet, according to this article
- It's extremely fast in rendering pages and making them look good
- It may be a memory hog, but developer machines are overpowered anyway
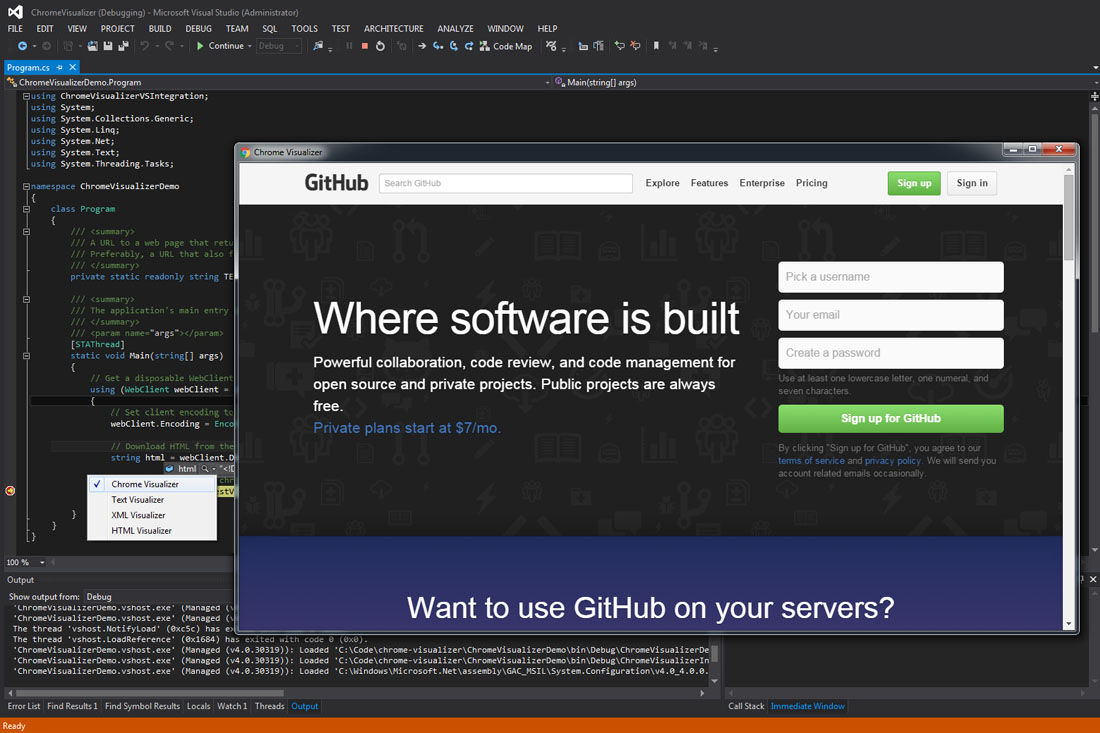
So I went ahead and created Chrome Visualizer, a Visual Studio Debugger Visualizer that makes it possible to view HTML strings in Chrome.
Chrome Visualizer
It's really easy to create a Debugger Visualizer, and Microsoft even provided a helpful walkthrough.
After completing the walkthrough, all that was left was to integrate Chrome into the project somehow. I found several options, but eventually settled on CefSharp, a project that provides .NET CLR bindings for The Chromium Embedded Framework (CEF). It even provides easy-to-use WPF and Windows Forms controls for embedding Chromium in .NET.
As an added bonus, CefSharp comes with Chrome Developer Tools included, with its nifty Elements tab, making it easy to navigate and modify the page HTML.
The result? An awesome Debugger Visualizer that makes debugging HTML strings fast and fun.
Features
- Extremely fast
- Responsive, unlike the built-in HTML Visualizer
- Built-in Chrome Developer Tools (F12)
Hotkeys
- Ctrl + U for View Source
- F12 for Chrome Developer Tools
Want to give it a shot, or have an idea for improving it? The project is hosted with love on GitHub.