Monitoring HTTP Health via Email Alerts on AWS
Sep 28, 2015
It's crucial to know when your HTTP APIs or web applications go down, even for a brief moment. Interruption of service could be extremely detrimental to you or your company's success, resulting in violated SLAs, unhappy customers, and possibly an angry boss. Even if you take steps to prevent this kind of situation, it's still a good idea to monitor your application endpoints to be alerted when the inevitable happens, just in case. You'd prefer to know about it immediately, rather than hear about it hours later from a disappointed client.
A lot of developers focus most of their time and energy into building their apps and deploying them to fancy servers, but they don't devote as much time to making sure these servers are constantly monitored, not only for hardware or network issues, but also for overall application health.
Setting up a HTTP health check on Amazon is extremely easy, thanks to Route 53's new Health Check feature:
Route 53 can monitor the health and performance of your application as well as your web servers and other resources. Route 53 can also redirect traffic to resources where your application is healthy.
Looks like Route 53 is definitely the right tool for the job. Basically, it's a service that will ping your endpoint every X seconds, from about 15 different cross-region instances, to make sure that your web site, API or other service is responding with a successful HTTP code.
HTTP and HTTPS health checks – Amazon Route 53 must be able to establish a TCP connection with the endpoint within four seconds. In addition, the endpoint must respond with an HTTP status code of 200 or greater and less than 400 within two seconds after connecting.
Pricing
The Route 53 Health Check costs just $0.50/month for the basic setup, as per the Route 53 pricing page. That's a great deal in my opinion, since it's a highly available and scalable service that would be a headache to set up on your own.
Setting Up a Health Check for Your Endpoint
Go ahead and visit the Route 53 Health Check management page in the AWS Console.
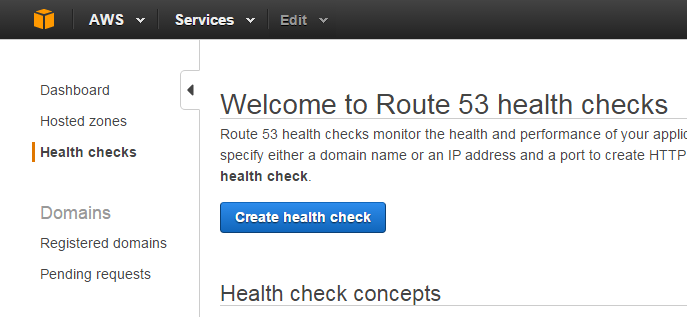
Click Create health check and you'll be presented with a health check configuration screen.
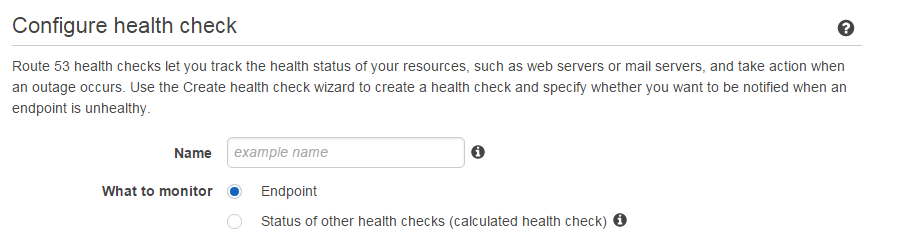
Initial Configuration
Start off by labeling your health check. This can be anything, but I'd recommend to set it to the domain or IP address that you will be monitoring, so you can easily recognize it if you create more health checks in the future.
What to monitor
You can leave Endpoint selected -- the other option makes it possible to create an aggregated health check that will combine the status of other health checks together to set up more complicated alert logic for them.
Endpoint Configuration
Next, you'll be configuring the actual health check -- the hostname of your service, protocol, port, and more.
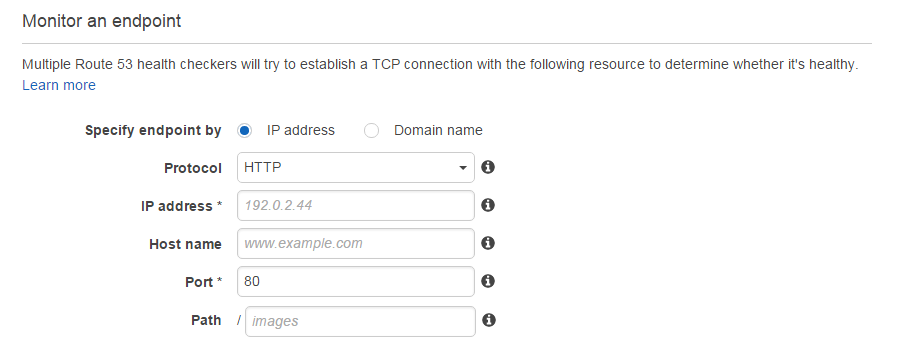
Specify endpoint by
Next, go ahead and select IP Address or Domain Name, based on the type of resource you will be monitoring. If you have an API at api.example.com, you'd select Domain Name. If you have a load-balanced endpoint and want to monitor a specific server, choose IP Address.
Protocol
Select the desired protocol. If you set up SSL for your endpoint, you should select HTTPS. Otherwise, leave the default HTTP option selected. Note that selecting HTTPS will cost you an additional $1/month for each endpoint.
IP Address or Domain Name
The hostname of your endpoint, either an IP or domain name.
Port
80 for HTTP, 443 for HTTPS.
Path
This is where things get interesting. First of all, if your API resides in example.com/api, you'd specify api in the health check path. Furthermore, if you'd like to set up custom health checks of your own, you can define a custom route in your API, e.g. /health, where you can make sure that your DB is alive and kicking, that 3rd party APIs are not down, and so on and so forth. In case any of your custom health checks fail, just return an error code, such as 500 Internal Server Error, and Route 53 will send an e-mail alert to notify you automatically.
This way, you can utilize Route 53 for two things at the same time: Making sure your endpoint is alive, and also making sure other things are in order. Two birds with one stone.
Advanced Configuration
You'll most likely not need to modify any of these, but here is an explanation for each feature, in case you have unconventional needs.
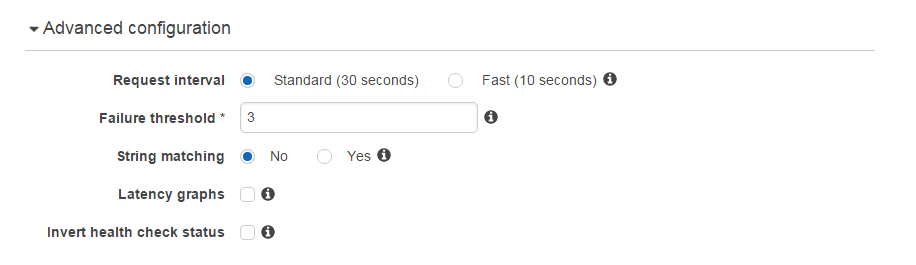
Request interval
Route 53 lets you customize the request interval to your endpoint if you want the health check to be performed in shorter intervals. Currently, the intervals allowed are every 30 seconds and every 10 seconds. Do note that this is a value on a per-instance basis, and Amazon states that about 15 cross-region health check instances will be pinging your endpoint at the same time, so in reality, your endpoint will receive health check requests every few seconds. Note that selecting Fast will cost you an additional $1/month for each endpoint.
Failure threshold
This value makes it possible to ignore those random, temporary failures that could be caused by a plethora of reasons and are impossible to debug. Set a threshold so you won't be woken up in the middle of the night because of a rare networking error.
String matching
This is a pretty cool feature. Amazon Route 53 makes it possible to verify that a specific string exists in your endpoint's response as part of the health check validation it performs on a regular basis. If checking for a 200 OK isn't enough for you, you can have Amazon validate that the string exists in the response. Note that this is a paid feature that will cost you an additional $1/month for each endpoint.
Latency graphs
In case you want to monitor your endpoint's latency, you can ask for a latency graph which will be visible in the Health Check dashboard for your new endpoint. Note that this is a paid feature that will cost you an additional $1/month for each endpoint.
Invert health check status
Not sure why anyone would need this, but basically, this feature will invert the endpoint status -- if it's down, you won't receive an e-mail. But you will if it comes back up.
Click Next to proceed to the next page.
Alert Configuration
The next step is to configure the e-mail alerts for when the health check fails. Route 53 uses CloudWatch and SNS to accomplish this.
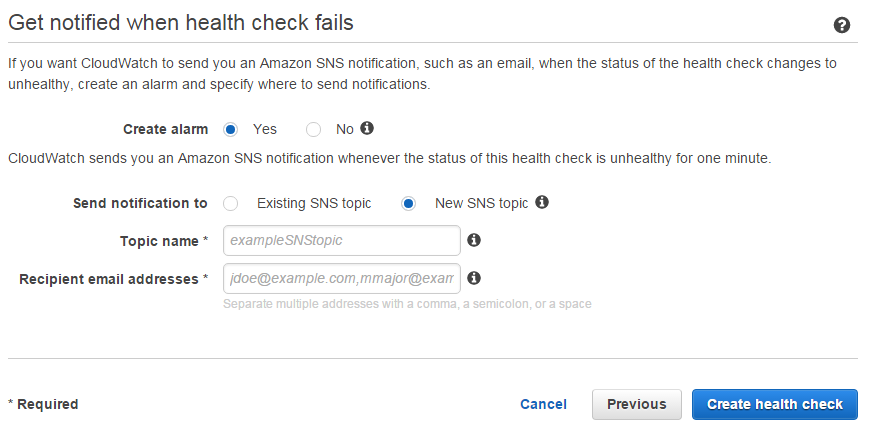
Create alarm
Select "Yes" to create a CloudWatch alarm for this health check. Otherwise, the health check status will only be visible in the AWS Console.
Send notification to
Select "New SNS topic", unless you already set up an SNS topic for your endpoint health check.
Topic name
Choose something to identify the endpoint's health checker.
Recipient e-mail addresses
Enter the e-mail address(es) which will receive the health check notifications.
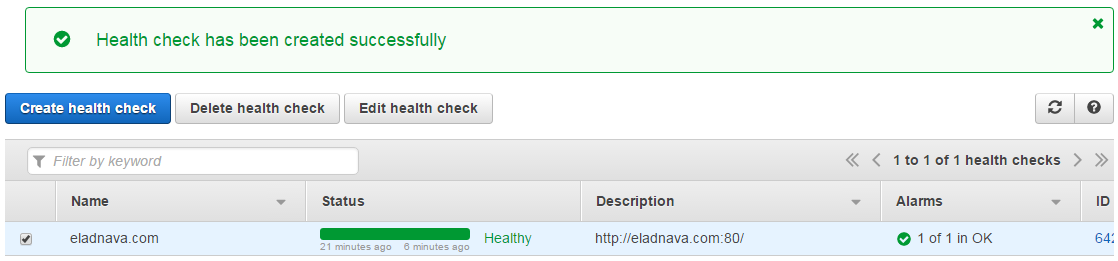
Finally, click Create health check to create the health check.
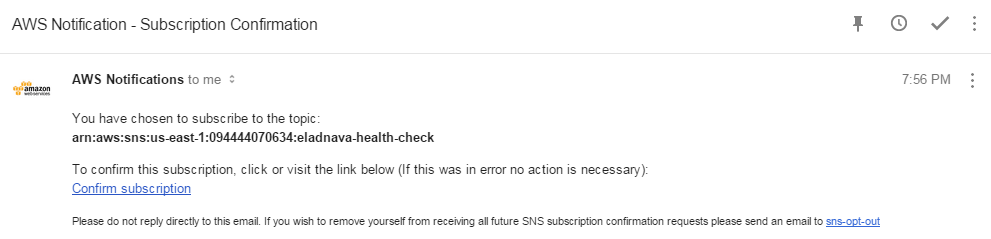
Confirm the SNS Subscription
The last step is to confirm the SNS subscription for the health check alert e-mails.
Log into the recipient e-mails and click the confirmation links, otherwise, you won't receive the alerts.
You're good to go. That was easy! Now you'll be notified when your endpoint goes down. No more upset clients or an angry boss when Apache runs out of memory and shuts down. :-)
Note: You should perform a test, to make sure that the health check actually works -- if you can, take down your endpoint and see if you get notified, to emulate a real downtime situation.